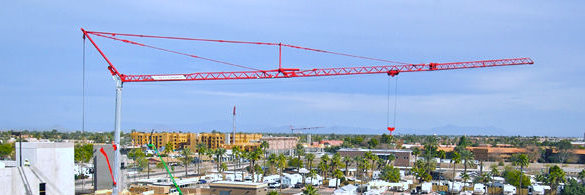
The Rider Levett Bucknall (RLB) Crane Index continues to be a crucial barometer for understanding construction growth in key cities across North America. The Q3 2024 edition sheds light on how cities are faring in terms of development, with crane activity indicating trends in urban expansion, housing booms, and infrastructure investments. For professionals in the crane industry, keeping tabs on these figures isn’t just a matter of curiosity—it’s vital information for business planning, fleet management, and market forecasting.
Crane Count Snapshot: A Clear Sign of Growth
According to the RLB Crane Index, the total number of active tower cranes in North America has increased by 4.74% in Q3 2024, a modest rebound from the slight dip in early 2024. This growth reflects ongoing investments in residential, mixed-use, and infrastructure projects. Notably, Toronto still leads the pack with 83 cranes, followed by Los Angeles with 42 cranes. Here’s a deeper look at the crane counts in major cities:
| City |
Crane Count Q3 2024 |
| Toronto | 83 |
| Los Angeles | 42 |
| Seattle | 28 |
| Calgary | 24 |
| Honolulu | 14 |
| Denver | 13 |
| Washington D.C. | 12 |
| Las Vegas | 11 |
| Boston | 9 |
| Portland | 9 |
| Phoenix | 8 |
| San Francisco | 6 |
| New York City | 5 |
| Chicago | 4 |
Toronto: The Skyline Continues to Grow
Toronto remains the construction capital of North America, with the city accounting for 83 cranes—an increase from the previous quarter. This growth is largely driven by a robust residential market, which makes up over half of the city’s cranes. Toronto’s development push comes at a time when the city is under pressure to meet its housing targets. Mixed-use projects are also prominent, with 26 cranes allocated to these types of developments. The ongoing investments in public infrastructure, education, and healthcare are critical drivers behind the crane growth.
Los Angeles: Rebounding with Infrastructure and Residential Projects
Los Angeles continues to hold the second-highest crane count in North America, with 42 cranes actively working on various projects. Mixed-use developments are the primary focus here, particularly as the city continues its push to address housing shortages and urban sprawl. Cultural and healthcare projects, while slower than in past years, are still contributing to the city’s crane count. Additionally, the expansion of LAX and various transport infrastructure improvements have ensured a consistent demand for crane services.
Calgary: Infrastructure Investments Push Crane Growth
Calgary is seeing a significant 20% increase in its crane count, reaching 24 cranes in Q3 2024. Major infrastructure projects, such as the Green Line LRT and the Calgary Events Centre, are pushing the demand for cranes. Residential construction remains a strong secondary driver, as the city expands to accommodate a growing population. This uptick in crane activity suggests that Calgary is becoming a hub for both public and private investment, particularly in the energy and infrastructure sectors.
Seattle: Steady Growth Amidst Tech Expansion
Seattle’s crane count remains stable at 28 cranes. As the city’s tech sector continues to attract new businesses and residents, the demand for both commercial office spaces and residential units is keeping the construction industry busy. Major projects in downtown Seattle and surrounding areas are ensuring that crane usage remains high, particularly for high-rise developments that blend commercial and residential purposes.
Denver and Honolulu: Consistency in the Mid-Tier Markets
Denver and Honolulu both report consistent crane activity, with 13 cranes and 14 cranes, respectively. Denver is seeing strong residential demand, especially in suburban areas, while Honolulu’s mixed-use projects continue to grow in the city’s core neighborhoods. Both cities are experiencing steady construction activity, ensuring that crane operators and contractors remain busy through the end of the year.
Key Trends Driving Crane Growth
- Residential Demand: Across North America, housing shortages are driving the need for new residential developments. Cities like Toronto, Seattle, and Denver are seeing substantial crane activity dedicated to residential construction, which makes up over 50% of all cranes in most major markets.
- Mixed-Use Projects: The trend toward urban densification and the blending of commercial and residential spaces is a key driver of crane activity. Mixed-use projects now account for approximately 22% of cranes in cities like Los Angeles and Seattle.
- Infrastructure Investment: In cities like Calgary and Los Angeles, infrastructure projects such as public transit expansions and cultural institution upgrades are fueling crane growth. These long-term investments in public infrastructure help stabilize the crane industry, especially in times when private investment might wane.
- Post-Pandemic Recovery: The return of delayed construction projects has contributed to the uptick in crane activity. As cities recover from pandemic-related slowdowns, projects that were once on hold are now progressing, pushing crane counts higher.
Looking Forward: A Promising Future for Crane Operators
As we look ahead to Q4 and beyond, the outlook for crane operators and contractors remains positive. With cities across North America continuing to invest in housing, infrastructure, and mixed-use developments, the demand for crane services will likely remain strong. However, challenges such as rising material costs and labor shortages could temper growth in the short term. Nonetheless, the steady increase in crane counts from Q3 2024 signals resilience and optimism in the construction industry.
For crane operators, understanding these trends is crucial for staying competitive and positioning your business for success. Whether you’re operating in high-demand markets like Toronto or emerging areas like Calgary, now is the time to ensure that your fleet is up-to-date, and your services are aligned with the needs of the construction industry.


